The Dashboard project for LHC experiments aims to provide a single entry point to the monitoring data collected from the distributed computing systems of the LHC virtual organizations. The Dashboard system (http://lhcdashboard.cern.ch) is supported and developed in the CERN IT.
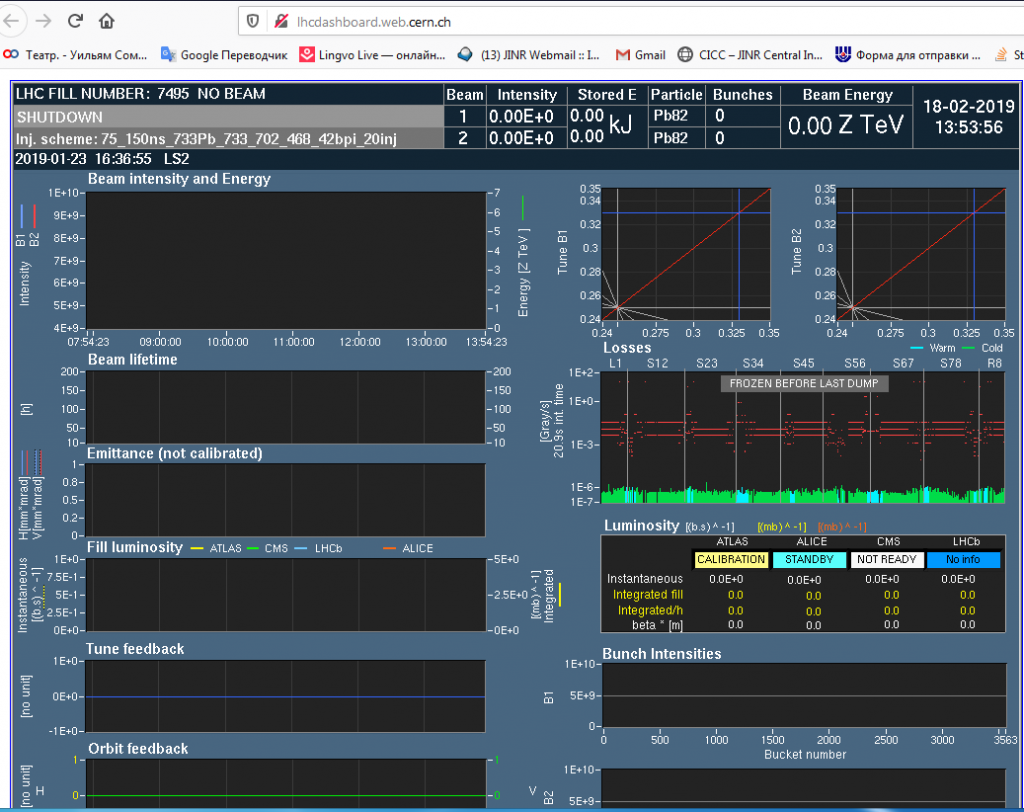
Collected data are sent to the servers of the Dashboard system, where they are combined with data from other sources (the job submission tools, job wrappers and so on). It allows to get the right general picture of functioning of the infrastructure and the work of virtual organizations.
While developing and improving the Dashboard system, the analysis and systematization of diagnostic messages about errors on aborted jobs in the grid environment were made. It resulted to changes and additions in the relevant tables of the of Dashboard system database.
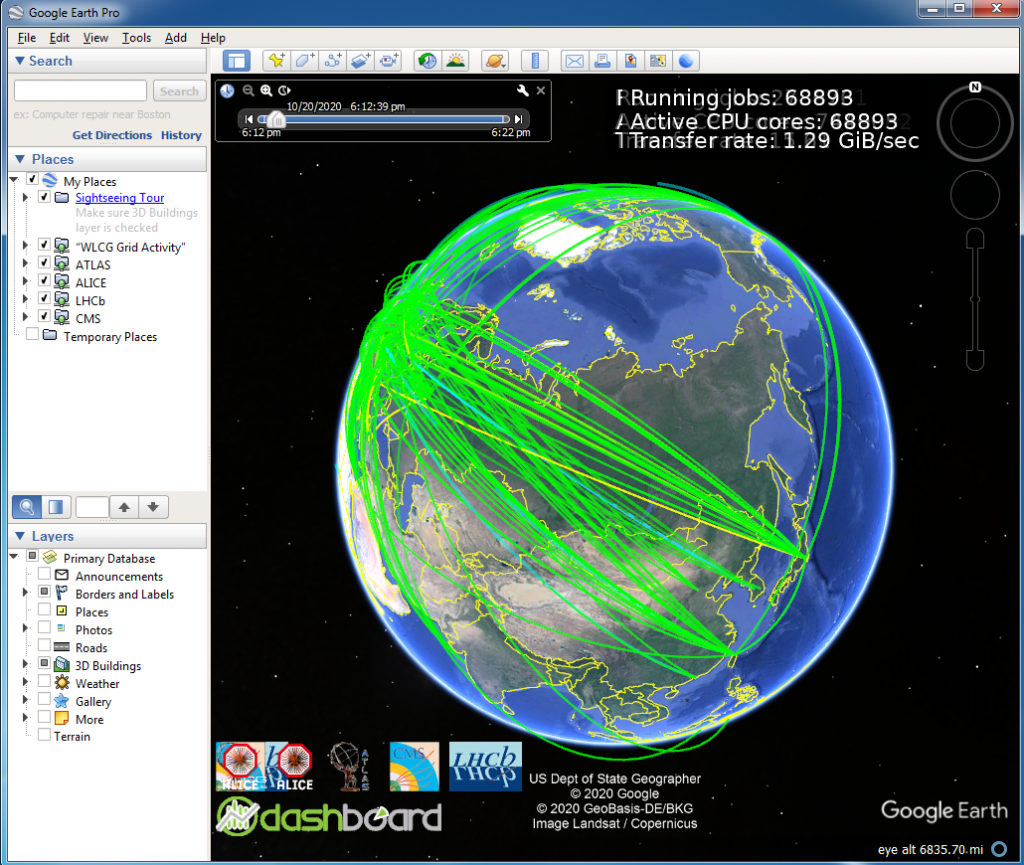
In the process of creating a visualization system for monitoring grid infrastructure, a new functionality was developed and implemented in Dashboard using the Google Earth application for dynamic monitoring in real time. Users have the ability to monitor the status of the WLCG in their own Google Earth setup.