In the process of creating a visualization system for monitoring grid infrastructure, a new functionality was developed and implemented in Dashboard using the Google Earth application for dynamic monitoring in real time. Users have the ability to monitor the status of the WLCG in their own Google Earth setup.
Google Earth can be installed on a windows, mac or linux machine and it should work in exactly the same way. Just go to the http://earth.google.com or https://www.google.com/intl/ru_ALL/earth/versions/#download-pro or https://support.google.com/earth/answer/21955?hl=ru&ref_topic=4363014 and download and install the latest version.
To be able to fetch and display remote map information, Google Earth provides a mechanism called Network Links. A Network Link is essentially a URL which points to an XML file that contains structured geographical information. These files can be uncompressed (having extension KML) or compressed to reduce network resource usage (having the extension KMZ).
Below is the list of steps you need to follow to import the KMZ file that represents the computing resources used by all the experiments.
- In the menu Add choose Network Link.
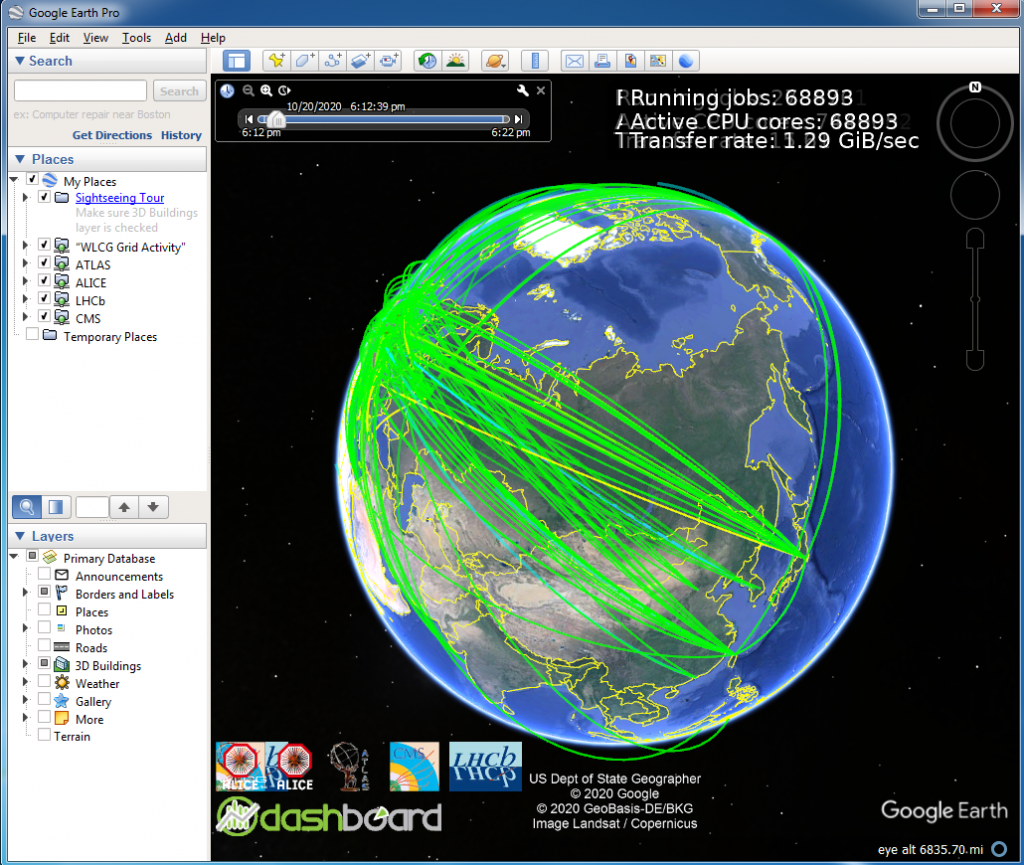
- In the Name box write a meaningful name to the map, say “WLCG Grid Activity”. In the Link box put the URL of the KMZ file – http://dashb-earth.cern.ch/dashboard/dashb-earth-all.kmz and click OK. In the Refresh tab you should set Time-based refresh to Periodically and set the period to 1 minute.You shouldn’t need to care about the other tabs (Style, Color, View) as the values required there are provided in the KMZ file itself.
- You should have a new entry in the Places box on the left side. For some reason Google Earth sometimes does not show the + sign which allows you to expand the data inside the link. You might need to right click on the WLCG Grid Activity place we just added and choose Properties, then select and deselect again the box “Show contents as options (radio button selection)” and somehow the + sign is now shown.
- Expand the WLCG Grid Activity link to see which data is there, making sure all of them get selected.
- As a last step and to improve the visualization, you should cleanup some of the default layers selected in the Primary Database (check the Layers box just below Places). The best option is to deselect everything apart from the Borders/International Borders checkbox, but you can play around and make it look different.It is also possible to visualize the activity of each Virtual Organization individually. Simply repeat the steps above providing an appropriate name and replace the URL of the KMZ file with one of the following ones:
Starting the animation
- On the upper right side of the earth visualization there is a time bar displayed with a small clock on the left. Click on the clock to get to the properties dialog.
- Change Display time in to Time zone on my computer so that you get values corresponding to the place you’re located in.
- Move the Animation speed bar to the minimum (all the way to the slower side).
- Make sure in “At end of the time range, animation should” it is set to Repeat, then click OK.
- Now select Tools / Options in the menu (on a Mac, this will be Google Earth / Preferences instead).
- In the 3D View tab, change Labels / Icon Size to Small, then click OK to get back to Google Earth.
- Finally hit the play button on the time bar and the animation will start.