To monitor the infrastructure of the CICC and its services in LIT,
a local monitoring system was developed on the basis of the freely
distributed Nagios software, as well as plug-ins written specifically
for the needs of the CICC.
The litmon system provides 24-hour monitoring of all resources;
notifies about failures;
allows to carry out a complex analysis of the complex’s operation and
provide up-to-date information on its operation to higher levels of monitoring.
There are 2 types of access to the litmon monitoring system:
1) https://litmon.jinr.ru/nagvis. Access with AFS account authorization for employees responsible for the performance of certain components of the CICC. Registration is via Ivan Kashunin email: miramir@jinr.ru
2) https://litmon-display.jinr.ru/nagvis. For the general information is provided access from the network without a password. For example :
Tier-1_WN:
https://litmon.jinr.ru/nagvis/frontend/nagvis-js/index.php?mod=Map&act=view&show=Tier-1_WN
The state of the hardware node of the accounting nodes (Work Nodes) of the JINR-T1 grid site .
Tier-1_themperature:
https://litmon.jinr.ru/nagvis/frontend/nagvis-js/index.php?mod=Map&act=view&show=Tier-1_temperature
Graph of temperature and humidity sensors of cooling units of the JINR-T1 grid site in the last 12 hours.
The objects of local monitoring can be divided into three levels:
1. Lower
collection and display of data on individual nodes of the network,
their hardware; they are checked for their availability on the network,
the status of power supplies, the temperature regime:
- monitoring servers using Nagios Remote Plugin Executor (776 nodes) – the state of processors, operating and disk memory, hardware and software;
- uninterruptible power supply (APC) – SNMP-monitoring;
- ventilation units of server racks (APC) – SNMP-monitoring;
- installation of climate control (Stulz) – SNMP-monitoring.
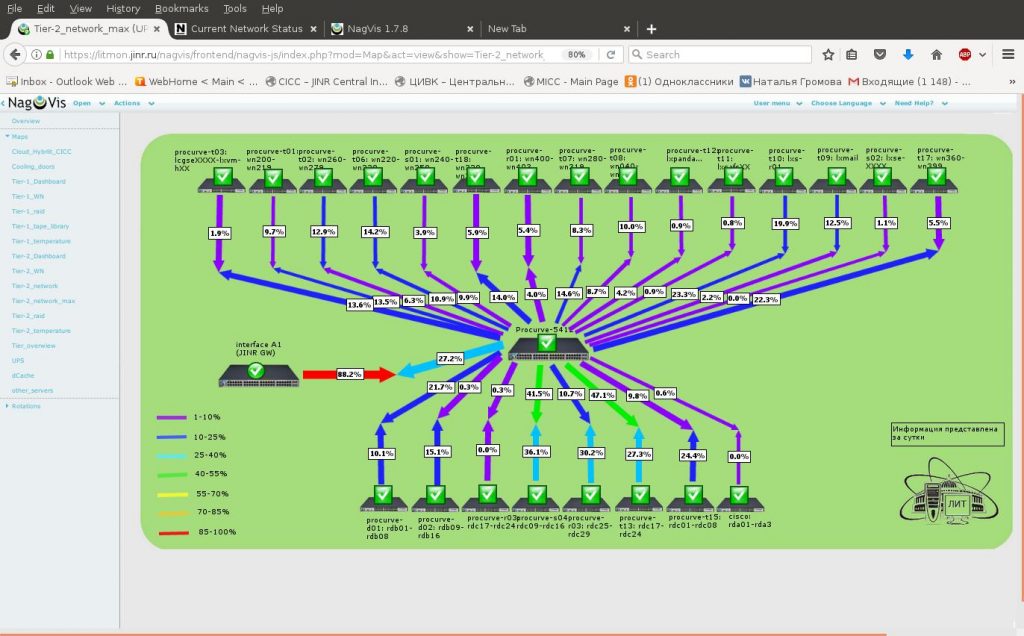
2. Network layer
devices and services that support the operation of the local network,
as well as the availability of external networks necessary for operation. The system monitors:
- HP Procurve switches (memory and CPU load, port characteristics) – SNMP monitoring;
- aggregated connections (trunks) – SNMP monitoring, MRTG;
- external channel.
3. Upper level (service level) –
control the operation of services provided to end users
- basic SMTP, POP, DNS, E-mail services (using standard Nagios plug-ins);
- file system dCache (developed by V. Trofimov scripts to collect metrics, run using NRPE);
- gFTP service
- RAID-arrays (3Ware, Adaptec), providing the work of dCache (integrated in a single plug-in monitoring tools for RAID manufacturers).
The data obtained as a result of the monitoring system under consideration has repeatedly contributed to the identification, localization and elimination of disruptions in the work of CICC services, as well as optimization of its individual elements.